EstimAge (Estimate of metilation Age) is a webservice for the computation of methylage, that is an epigenetic marker of age (epigenetic clock) identifying specific CpGs on the genome whose methylation state is globally (linear combination) correlated to chronological age in any tissue or cell type. From the pioneering work of Horvath (Horvath, 2013) epigenetic clocks’ employment, resulting from the evaluation of the difference (DeltaAge) between methylage and chronological age, has been under active research in a variety of clinical areas as marker of overall health condition during aging, with the potential to become a relevant risk indicator for the major age-related diseases, syndromes and conditions, including cancer. To date methylage has been offered, exploiting retrospective data, either as a tissue-independent or tissue-specific marker. It is now assessed that tissue-specificity enables better precision, therefore numerous efforts have been turned to the construction of sufficiently large bases of data (mostly Illumina Beads Arrays) extracted from specific tissues under specific conditions, to identify robust CpGs, enabling reproducibility of the results. Despite widespread interest in the matter, little standardization has been promoted so far, preventing efforts coordination. To the best of our knowledge, this is the first hub collecting epigenetic clocks.
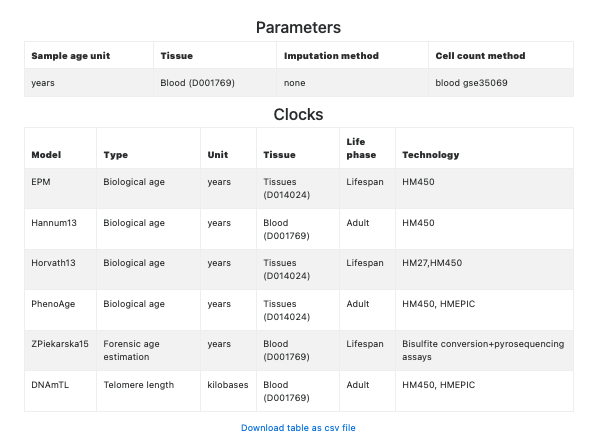
Currently available clocks in EstimAge are listed here.
We encourage authors to submit novel, peer reviewed, software-equipped clocks to our webservice via the contact page.
Data submission
A worked example using a subset of real data (GEO accession number GSE72776) from whole blood (tissue Blood; D001769) is offered in the main page.
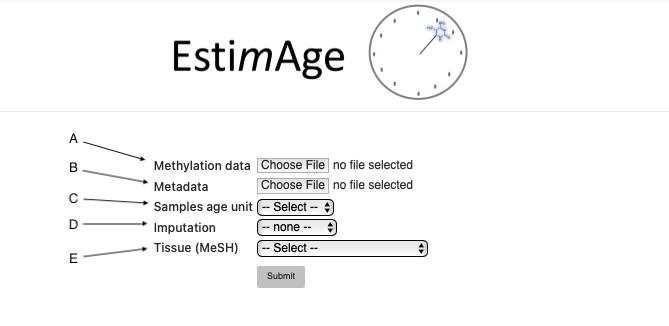
Select the "Choose file" button next to the "Methylation data" label to upload a beta value file from your local folder. File format description here.
Select the "Choose file" button next to the "Metadata" label to upload a metadata annotation file from your local folder. File format description here.
Select the samples age unit (cell counts, kilobases, weeks, years). The selection should be consisent with the age unit values provided in the metadata file. Detailed description here.
If missing data are present in the beta values file, they can be imputed using one of three different imputation methods. Detailed description here
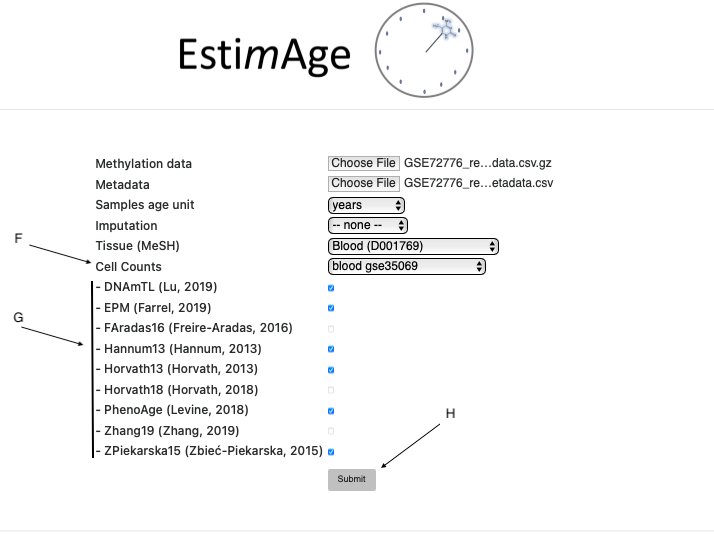
Select a tissue from the “Tissue (MeSH)” menu. The tissue selection opens further options, as shown in Figure 2. Detailed description here
Figure 2. Data submission steps after Tissue selection
Select a cell counting method. Only tissue-compatible methods are shown. Detailed description here
Select clocks. Only tissue-compatible clocks are shown. List of available clocks here.
Submit the job. Uploads the data and redirects to the wait page.
The job is scheduled for running as soon as the waiting queue is empty. Upon completion, a link to the result page is made available.
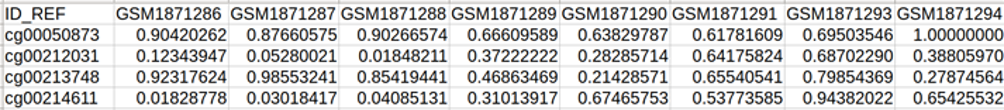
ID_REF: containing the probes ID as indicated in the Illumina DNA methylation platforms (Infinium HumanMethylation450 BeadChip, GEO accession number GPL13534; Infinium HumanMethylation27, GEO accession number GPL8490; Infinium MethylationEPIC BeadChip, GEO accession number GPL21145), or the clock specific probes ID indicated in Table 1. If the CpGs required by a selected clock are not provided and cannot be imputed, NA will be returned in the output tables
All other columns are named after the same sample IDs used in the Metadata file and contain the corresponding beta values.
Figure 3. Example of beta values file. The figure shows the first 5 rows (4 CGs) and the first 9 columns (8 samples) of the example input file.
If no data is upladed, the example GSE72776_restricted.data.csv.gz file (available in the main page) is used by default.
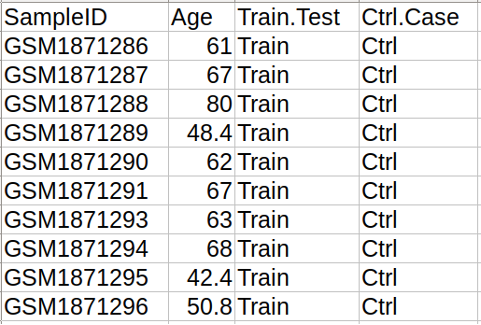
SampleID: specifies the sample ID, that should match the column names of the Methylation data file.
Age: age of subjects (samples) in years, weeks, cell cycles or kilobases unit.
Train.Test: optional column, specifying if the sample should be in the training or in the test set in EPM clock (see clock list), where the clock is trained on the training set ("Train") and then used to predict the methylage of both the training ("Train") and the test ("Test") samples. If missing, all samples are included in the training set.
Ctrl.Case: optional colum, specifying if the sample is in the control group (“Ctrl”) or not (“Case”). This column is used by Estimage to generate the outputs as detailed in the Results. If missing, all samples are considered to be controls.
Figure 4. Example of Sample annotation file. The figure shows the first 11 rows of the Sample annotation file, with 10 samples ID mapped to the Methylation data file.
If no data is upladed, the example GSE72776_restricted.metadata.csv file (available in the main page) is used by default.
The selected age unit should be consistent with the age values provided in the
Metadata file. This parameter determines the type of plots/tables
that will be shown in the result page, according to the selected clocks.
mean - Simple and fast imputation method that simply replaces the missing value of a given variable by averaging all the known values for that variable.
methyLImp (Di Lena et al., 2019) - Linear regression imputation method, specifically designed for the imputation of methylation data.
The imputation, if selected, is performed separately on cases and control samples. Some clocks (e.g. Horvath13, epiTOC, DNAmGA, MEAT) provide their own imputation algorithm or alternative solutions that will be used if missing data imputation is not explicitly requested or if missing data are still present after imputation.
Tissue - mandatory. Tissue selection should be consistent with the Methylation data provided in input. Tissue hierarchy and IDs are taken from the National Library of Medicine's (MeSH, (https://meshb-prev.nlm.nih.gov/search) controlled vocabulary thesaurus, that consists of sets of terms naming descriptors in a hierarchical structure to be queried at various levels of specificity. This enables better standardization for usage on users’ datasets. Currently, EstimAge’s available tissues are:
Blood; D001769
Endothelial cells; D042783
Fetal Blood; D005312
Mouth Mucosa; D009061
Muscle, Skeletal; D018482
Neoplasms; D009369
Placenta; D010920
Prefrontal Cortex; D017397
Saliva; D012463
Skin; D012867
Other
If any tissue among options 1)-10) is selected, EstimAge presents only the appropriate subset of tissue-compatible clocks. The user can then decide to select all or some of those. If none is selected, EstimAge preselection is computed by default, the rationale being that appropriate clocks exists and should be preferred. Equivalently, only tissue-compatible cell counting methods are shown (if any).
If tissue option 11) is selected, all EstimAge clocks are shown (no pre-selection) to allow the user to make a custom and broad selection. If none is selected, only multi-tissue clocks will be computed, the rationale being that the specific clock does not exist and only multi-tissues should be computed. Equivalently, all cell counting methods become available for selection.
The “Other” tissue should be selected if the user wants to escape EstimAge pre-selection and visualize all available clocks, as well as all available cell counting methods.
Cell counts - optional. We provide several cell counting methods, for different tissues, following datasets used in standard Bioconductor Packages minfi and meffil:
andrews and bakulski cord blood (Fetal Blood; D005312)
blood gse35069 (Blood; D001769)
blood gse35069 chen (Blood; D001769)
blood gse35069 complete (Blood; D001769)
combined cord blood (Fetal Blood; D005312)
cord blood gse68456 (Fetal Blood; D005312)
gervin and lyle cord blood (Fetal Blood; D005312)
guintivano dlpfc (Cerebral Cortex; D002540)
saliva gse48472 (Saliva; D012463)
The cell counting method selection becomes available only after Tissue selection:
If "Other" tissue is selected, all cell counting methods are available for selection
Conversely, only the tissue-compatible cell counting methods are shown (if any)
The results page contains a summary of the estimated methylage, as computed by the selected clocks, together with several statistical
analyses both in tabular and graphical format. In detail, the result page is organized according to the following Sections (which can be
quickly browsed through a global index at the beginning of the page):
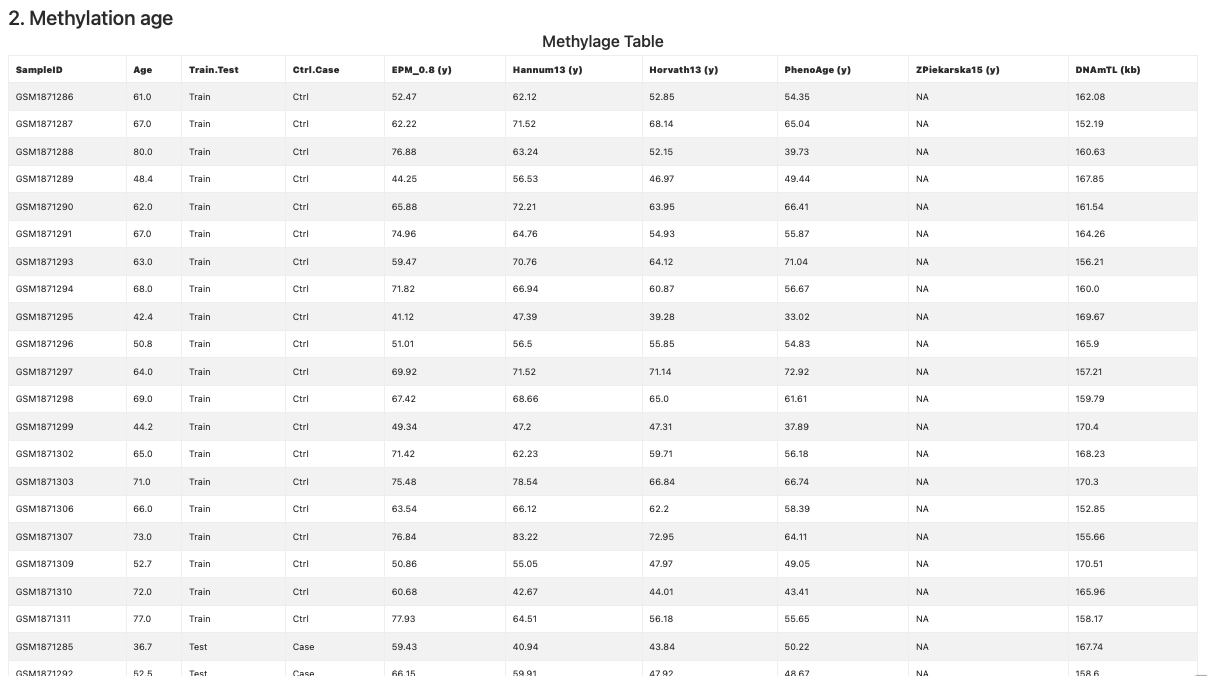
This section contains the Methylage Table (see Figure 6), showing the information provided in the metadata file, followed the estimated methylage, one per clock, column-wise. If the CpGs required for the computation of the clock are not available and could not be imputed, then the corresponding column contains NAs (see the column related to Zpiekarska15 clock in Figure 6).
Figure 6. Methylage Table
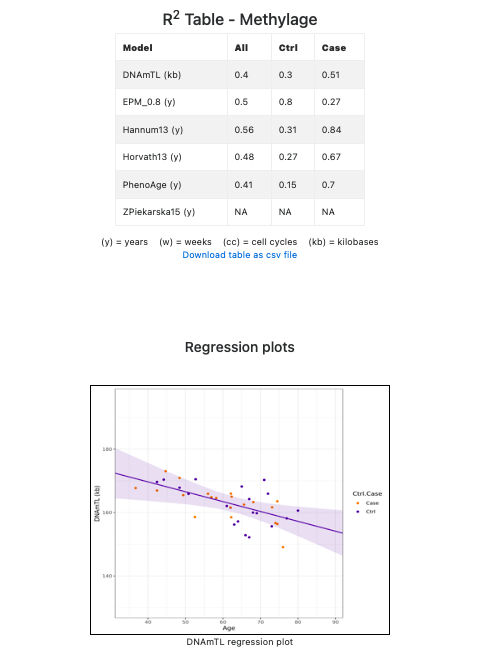
In the same section, EstimAge provides the R2 regression coefficients in tabular format and the regression lines in graphical format for each epigenetic clock (see Figure 7).
Figure 7. R2 regression statistics in tabular and graphical format.
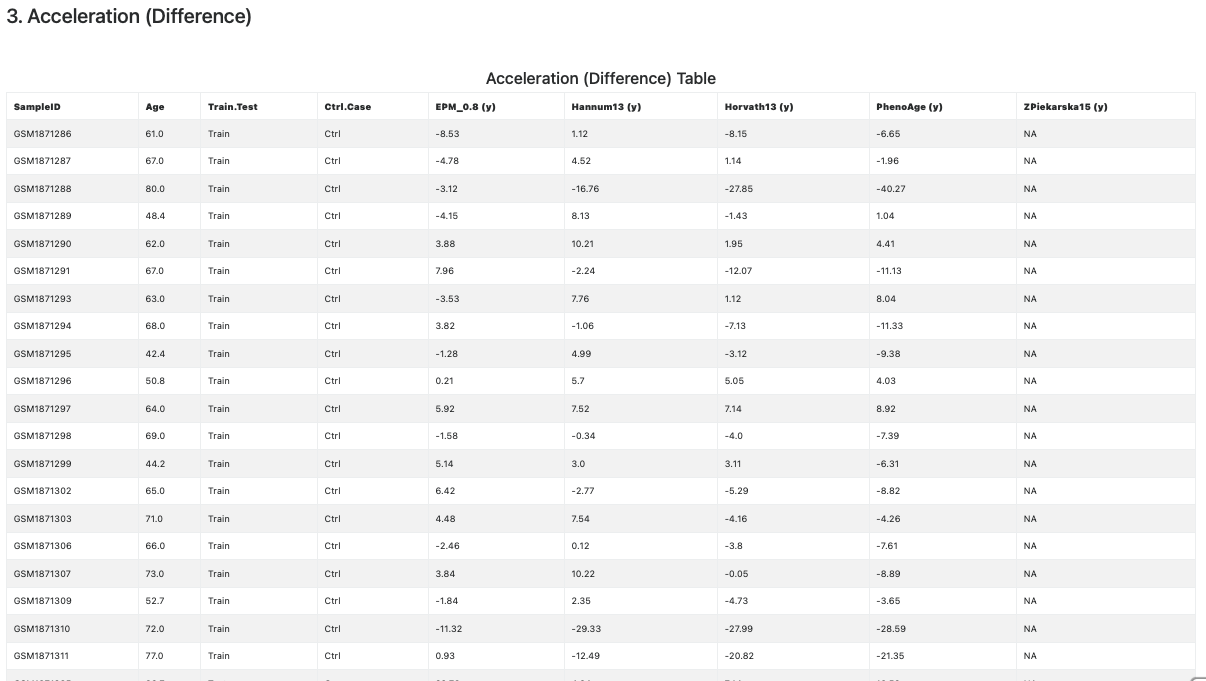
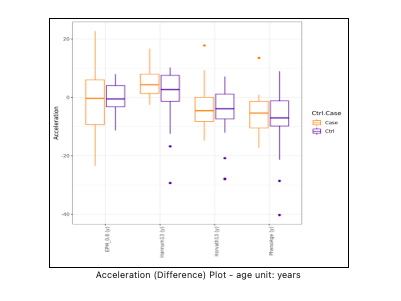
This section provides age acceleration statistics. Accelerations or decelerations (positive and negative divergences, respectively) from physiological methylation values offer a measure of the divergence from a physiological state. Importantly, such variations are measurable long before clinical signs of diseases become overt.
The age acceleration is computed as the difference between methylage and age. These statistics are meaningful only when samples age unit is compatible with the clock’s units (years, weeks, cell counts, kilobases). Therefore EstimAge reports only the clocks for which this condition is true.
The age acceleration (by difference) statistics is reported in both tabular (see Figure 8) and graphical (see Figure 9) format.
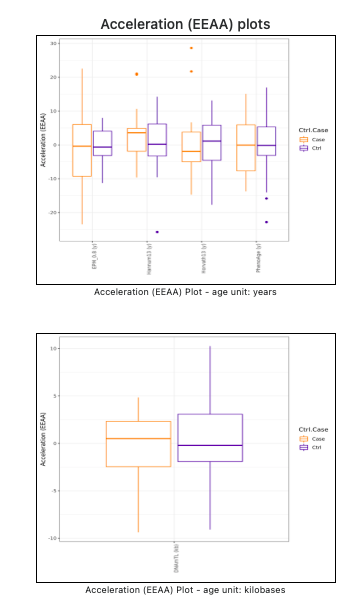
This section provides a second measure of age acceleration, the Extrinsic Epigenetic Age Acceleration (EEAA) statistics (Horvath et al., 2015; Smith et al., 2019), computed as the residual from a regression of methylage onto the sample Age. Differently form the acceleration statistics by difference, the EEAA statistics can be computed for all samples age unit measures. However, these statitics are not computed if the input data contains less than three samples.
Also in this case the EEAA statistics is reported in both tabular (see Figure 10) and graphical (see Figure 11) format. The plots are given separately for each age unit.
Figure 10. Extrinsic Epigenetic Age Acceleration (EEAA) statistics (table).
Figure 11. Extrinsic Epigenetic Age Acceleration (EEAA) statistics (plots).
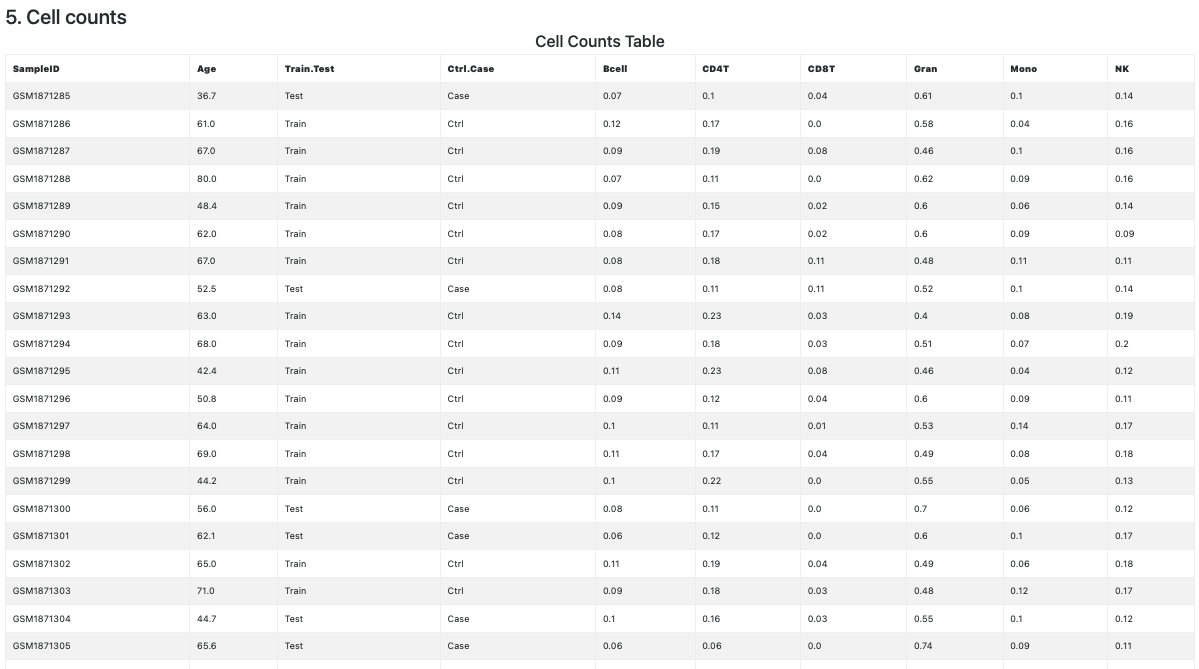
This section is devoted to cell counts calculations and satistics. The Cell Counts section appears only if some cell counting method is selected in the input interface.
The table of the estimated cell counts (see Figure 12) is provided only for cell types whose maximum relative abundance is higher than 10.
Figure 12. Cell Count table
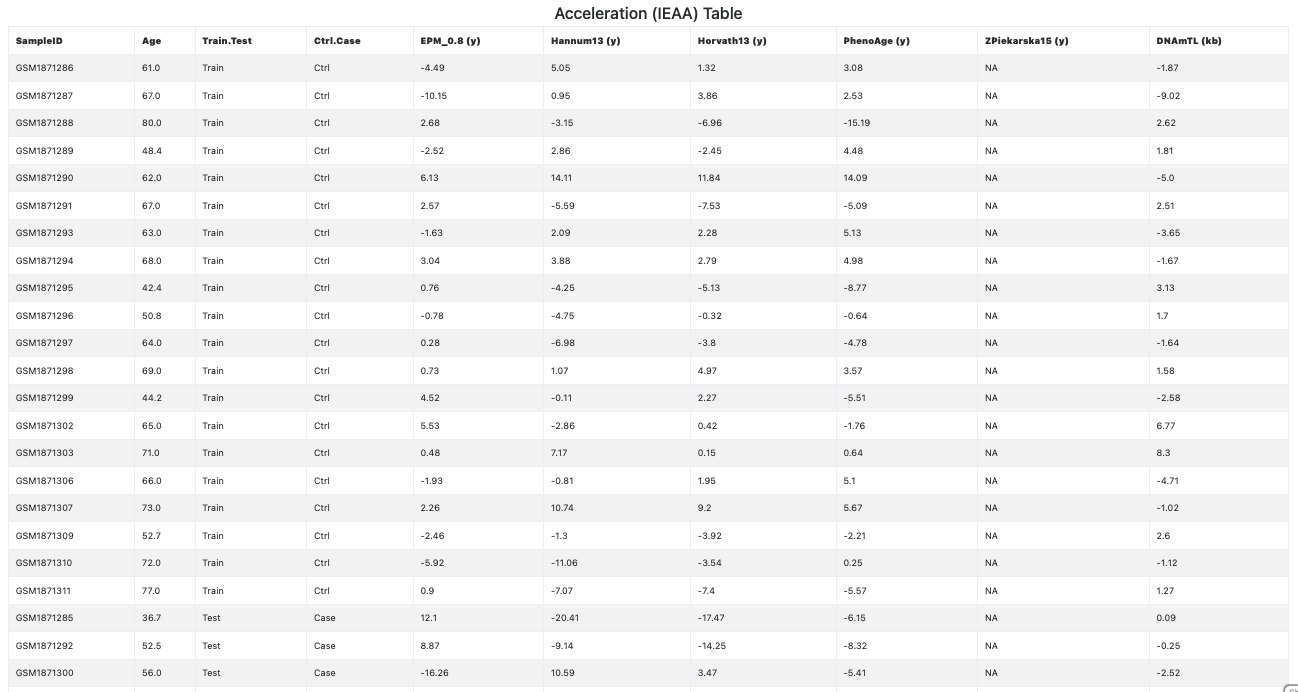
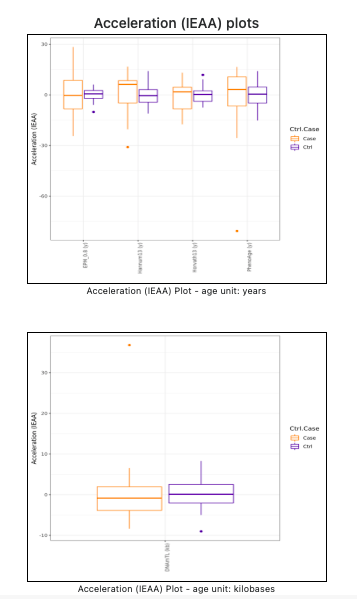
A third acceleration statistics (see Figure 13), the Intrinsic Epigenetic Age Acceleration (IEAA), is computed as the residual from a regression of methylage on the samples Age, adjusted for the estimated cell counts (Horvath et al., 2015; Smith et al., 2019). If all the samples are less than the number of cell types, the IEAA statistics cannot be computed and, thus, it is not shown. If computable, the IEAA statitics is also shown in separate plots for each age unit (see Figure 14).
Figure 13. Intrinsic Epigenetic Age Acceleration (IEAA) statistics (table)
Figure 14. Intrinsic Epigenetic Age Acceleration (IEAA) statistics (plots)
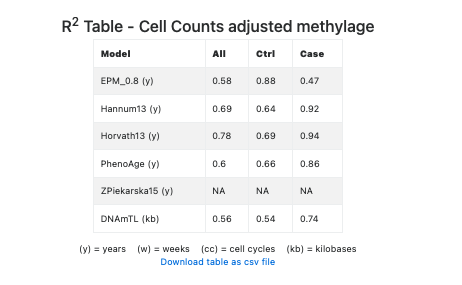
Finally, this secton includes a table showing the R2 of each regression model (see Figure 15), adjusted for the estimated cell counts.
Figure 15. R2 regression statistics adjusted for the estimated cell counts
References
Di Lena, P., Sala, C., Prodi, A., Nardini, C. (2019) Missing value estimation methods for DNA methylation data. Bioinforma. Oxf. Engl. 35, 3786–3793. https://doi.org/10.1093/bioinformatics/btz134
Horvath,S. and Ritz,B.R. (2015) Increased epigenetic age and granulocyte counts in the blood of Parkinson’s disease patients. Aging (Albany NY), 7, 1130–1142. https://doi.org/10.18632/aging.100859
Smith,J.A., Raisky,J., Ratliff,S.M., Liu,J., Kardia,S.L.R., Turner,S.T., Mosley,T.H. and Zhao,W. (2019) Intrinsic and extrinsic epigenetic age acceleration are associated with hypertensive target organ damage in older African Americans. BMC Med Genomics, 12, 141. https://doi.org/10.1186/s12920-019-0585-5
Troyanskaya, O., Cantor, M., Sherlock, G., Brown, P., Hastie, T., Tibshirani, R., Botstein, D., Altman, R.B. (2001) Missing value estimation methods for DNA microarrays. Bioinformatics 17,520–525. https://doi.org/10.1093/bioinformatics/17.6.520